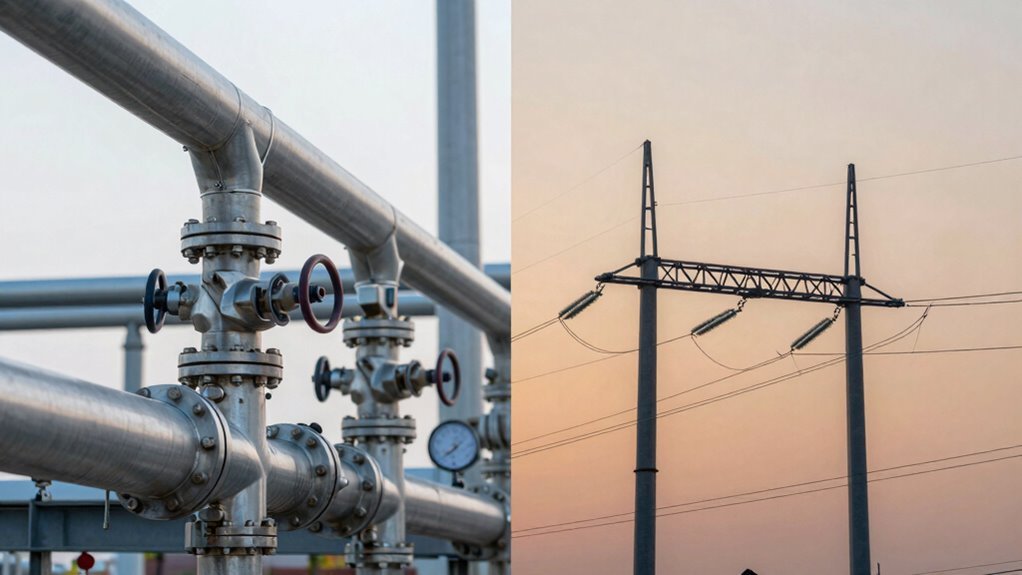
Most businesses waste thousands on dual fuel contracts by ignoring five critical metrics that suppliers don't want you to know. These hidden factors determine your real costs.
Most businesses are haemorrhaging money on dual fuel contracts without realising it.
Your company’s energy bills could be draining thousands more than necessary, yet 9 out of 10 business owners believe they’re getting competitive rates simply because they bundled gas and electricity services together. The brutal reality? Dual fuel agreements often create the illusion of savings whilst hiding profit-crushing variables that suppliers rarely explain upfront. Five overlooked metrics separate genuinely cost-effective contracts from expensive traps disguised as bargains. These hidden factors determine whether your business captures real operational savings or remains trapped paying inflated rates for years.
Before You Lock In: 5 Metrics That Actually Change Your Bill
When businesses sign energy contracts, most focus on a single number: the per-unit rate. This approach overlooks five critical metrics that greatly impact final bills.
Peak Demand Charges (kW) represent instantaneous power draw, not consumption. These charges can comprise approximately 40% of summer commercial bills in certain regions.
Demand charges guarantee utilities maintain capacity for peak usage periods. Fixed charges like interconnection fees also appear on bills as flat monthly costs separate from usage-based expenses. Working with an energy adviser can help identify which charges apply to your specific business location and contract terms. A structured tendering service ensures you secure competitive contracts that account for all charge components.
Total Energy Consumption (kWh) measures actual electricity supplied. Consumption tracking forms the foundation for comprehending cost drivers.
Reducing overall consumption directly lowers supply and transmission charges. Enerbiz helps UK businesses profile usage patterns to identify where consumption can be reduced most effectively. A six-step energy cost reduction process ensures systematic identification of waste and implementation of measurable savings. Comparing consumption across different suppliers reveals how automated energy quote engines can minimise billing errors and provide precise estimates.
Time-of-Use Rate Structures vary by hour, day, or season. Shifting energy-intensive operations to off-peak periods reduces spending considerably without decreasing consumption.
Fuel Costs & Wholesale Supply Prices fluctuate based on natural gas availability and market conditions.
Supply charges vary accordingly across regions.
Location & Regional Infrastructure Factors determine transmission and distribution costs.
Local demand and regional procedures create utility-specific variations. Understanding your usage profiling ensures accurate comparisons across the 20+ suppliers available in the UK market.
How Dual Fuel Bundles Save Money vs. Separate Contracts
Many businesses assume that bundling gas and electricity with a single supplier automatically delivers savings, yet the reality demands careful comparison. Bundled benefits include consolidated billing and unified account management, reducing administrative coordination. A single point of contact simplifies complaint resolution and queries.
Bundled gas and electricity offers convenience through consolidated billing, yet automatic savings remain unproven without careful comparison.
However, competitive advantage varies considerably by supplier and market conditions.
Savings strategies require analysing individual consumption levels and geographical location. Same-supplier bundling may reveal exclusive discounts unavailable through separate contracts, with fixed-rate options potentially saving £100+ annually against price cap rates. Direct Debit payment methods remain the most common approach for managing dual fuel accounts. Enerbiz recommends comparing supplier-neutral shortlists from multiple providers to ensure you’re accessing the best available rates. Our quarterly reviews help identify emerging savings opportunities and market shifts that could benefit your business. Real-time data allows you to lock in live market rates instantly upon request.
Market analysis reveals potential savings exceeding £200 through strategic tariff selection.
Exit fees ranging £7–£100+ per fuel apply to fixed-rate bundled contracts if terminated early. Variable-rate bundled options provide greater flexibility for switching.
Thorough market comparison across all available tariffs remains essential for identifying ideal value rather than assuming bundled packages automatically deliver the lowest rates.
Compare Supplier Rates and Standing Charges (January 2026)
Supplier rates and standing charges in January 2026 reveal significant variation across the UK business energy market, with standing charges factoring substantially into total monthly expenditure alongside per-kWh unit rates.
Regional differences are pronounced—the Southern Western region recorded the highest average gas unit rate at 6.14p/kWh, whilst electricity rates for small businesses averaged 27.57p/kWh across all suppliers.
Businesses renewing contracts during this period face a critical choice: locking current rates or waiting for spring seasonal discounts, with spring 2026 projections showing gas at 78.98p/kWh and power at £77.01.
Unit Rate Comparison Analysis
How do business energy costs break down across different company sizes? Unit rates vary notably across consumption brackets, reflecting supplier competition and market activity.
Small businesses consuming 10,000-50,000 kWh annually face gas rates averaging 6.0p per kWh, with micro-businesses (5,000-15,000 kWh) paying 7.1p per kWh.
Medium businesses (50,000-100,000 kWh) secure better rates at 5.5p per kWh gas, whilst large consumers (100,000+ kWh) achieve 5.3p per kWh.
Electricity rates present a sharper cost burden. Small business electricity averages 26p per kWh—approximately 4.3 times higher than gas rates.
Medium and large businesses face 26.3p and 25.0p per kWh respectively.
Over 30 competing suppliers create pricing pressure, though rate fluctuations remain modest.
January 2026 market data showed gas ranging 6p-8p per kWh, indicating stabilised conditions despite wholesale cost increases.
Standing Charge Impact Breakdown
Beyond the unit rates that determine how much energy costs per kilowatt-hour, standing charges represent a fixed daily cost that all business energy customers must pay regardless of consumption levels. This cost analysis reveals the significant financial impact of standing charges on annual expenditure.
| Fuel Type |
Daily Rate |
Annual Cost |
| Electricity |
54.75p |
£199.84 |
| Gas |
35.09p |
£128.08 |
| Combined |
89.84p |
£327.92 |
| Previous Period Electricity |
53.68p |
£195.93 |
| Previous Period Gas |
34.03p |
£124.11 |
Standing charges increased 1.07p for electricity and 1.06p for gas between October 2025 and January 2026. These fixed costs accumulate to approximately £327.92 annually before any energy consumption occurs. Direct Debit payment methods receive standardised standing charge rates across all distribution network areas. Grasping standing charge impact helps businesses evaluate total energy expenses thoroughly.
Why Your Business Location Changes Your Quote?
When a business requests an energy quote, the postcode matters as much as the consumption figures. Location factors directly shape pricing fluctuations across the UK market.
Regional infrastructure costs determine delivery expenses. Utilities recover transmission and maintenance fees through postcode-specific rate adjustments. Distribution networks vary considerably by area, affecting per-unit charges.
Regional infrastructure costs shape delivery expenses, with utilities recovering transmission and maintenance fees through postcode-specific rate adjustments.
Supply and demand imbalances create regional pricing differentials:
- Urban areas experience capacity constraints, elevating rate structures for concentrated business zones.
- Industrial clusters benefit from economies of scale, reducing per-unit costs through supplier competition.
- Rural postcodes face higher transmission distances, increasing infrastructure recovery charges.
Regional regulatory systems establish different demand charge structures and contract standards. Geographic location determines applicable utility commission jurisdiction.
Business rates include 20% VAT, varying by jurisdiction. Northern England commercial rates average 11.9p/kWh versus London at 24.4p/kWh, reflecting regional policy differences and fuel availability.
Fixed or Variable: Which Rate Protects Your Bottom Line
Your business location shapes what energy prices look like, but your choice between fixed and variable rates determines how those prices affect your bottom line.
Fixed rate advantages include budget predictability, consistent monthly bills, and protection from market volatility. Finance teams benefit from straightforward expense forecasting when energy costs remain constant throughout 6, 12, or 24-month contract terms.
Variable rate disadvantages emerge during price spikes. Monthly bills fluctuate based on wholesale market conditions, creating budgeting challenges and unexpected cost increases during high-demand periods.
Businesses face unpredictable rate changes monthly or quarterly, removing consistency from financial projections.
The decision hinges on operational priorities. Organisations valuing stability and risk reduction select fixed rates.
Those with seasonal operations or flexible consumption patterns utilise variable rates for potential savings during favourable market conditions.
Calculating Your True Annual Cost Beyond Unit Rates
Businesses comparing dual fuel rates often focus solely on unit prices, overlooking the standing charges and fixed fees that constitute 20-40% of annual energy bills.
True cost calculations require separating fixed monthly service charges, demand charges, and regulatory surcharges from variable per-unit consumption costs, then projecting how seasonal usage patterns affect total annual expenses.
Comprehending this complete cost structure—rather than headline rates alone—reveals which supplier arrangement genuinely protects operational margins across 12-month billing cycles.
Standing Charges Impact Analysis
Standing charges represent a fixed daily cost that suppliers add to every business energy bill, independent of how much electricity or gas the organisation actually consumes.
These charges range from 25p to 160p daily and cover network infrastructure maintenance across the UK.
Standing charge implications vary considerably by business size. Micro-businesses using 2,500 kWh annually face standing charges representing 16% of total bills. Larger operations (25,000-50,000 kWh) allocate approximately 7.36% to these fixed costs.
Standing charge variations depend on several factors:
- Business location and distance from the nearest substation
- TCR band assignment affecting regional network costs
- Energy deal type selected with individual suppliers
Comparing total contract costs rather than unit rates alone guarantees accurate identification of genuinely cost-effective options.
Businesses should evaluate complete annual expenses when reviewing dual fuel proposals.
Fixed Versus Variable Comparisons
How can a business identify the true cost of an energy contract when quoted rates tell only part of the story? Fixed rate advantages and variable rate flexibility demand separate analysis beyond unit pricing.
| Factor |
Fixed Rate |
Variable Rate |
| Contract Length |
12-60 months locked |
Month-to-month flexibility |
| Rate Stability |
Consistent regardless of market |
Fluctuates with energy markets |
| Early Exit Penalties |
Potential termination fees apply |
No penalties for switching |
Fixed rates shield businesses from seasonal price spikes, enabling predictable annual budgeting. However, early termination fees must be calculated into true annual costs if circumstances change.
Variable rate flexibility permits switching anytime without penalties, though rates adjust quarterly or semi-annually. True cost comparison requires adding prorated exit fees to fixed-rate quotes and applying market volatility buffers to variable projections. Usage patterns multiplied against anticipated rate ranges establish realistic cost limits for accurate annual forecasting.
Usage Pattern Cost Projections
Unit rates alone cannot reveal the actual annual cost of an energy contract. Usage patterns determine how consumption distributes across peak and off-peak periods, directly affecting total expenditure.
Businesses consuming 5,000-15,000 kWh annually face costs around £1,013 per year, whilst those using 15,000-30,000 kWh incur approximately £2,046 annually.
Cost forecasts require analysing historical consumption data against Expected Annual Consumption (EAC) estimates. This comparison identifies seasonal variations and operational inefficiencies.
Strategic observations emerge from detailed usage pattern analysis:
- Peak demand periods reveal opportunities to reschedule energy-intensive tasks to lower-rate off-peak hours
- Historical consumption tracking establishes baselines for detecting unusual spikes indicating equipment malfunctions
- Multi-year records support long-term projections and accurate budget forecasting
Systematic consumption monitoring through Metre Point Reference Numbers (MPRN) enables businesses to enhance spending beyond simple rate comparisons.
Standing Charges: The Cost You Can’t Avoid
Every business electricity bill in the UK includes a fixed daily fee that applies regardless of how much energy the premises consumes. This standing charge covers network maintenance, metre readings, and administrative processing costs. Suppliers charge between 5p and 50p per day, depending on business size and region.
Micro businesses pay approximately £888 annually in standing charges alone. Small businesses face £2,884 yearly costs. Medium and large businesses encounter considerably higher standing charge implications, with charges comprising 5–17% of total bills.
These hidden costs persist even when premises remain unoccupied. Some suppliers offer zero standing charge alternatives featuring notably higher unit rates (approximately 30p per kWh versus 25p standard).
Businesses must calculate annual costs across consumption levels to determine ideal tariff structures and minimise overall energy expenditure.
Switch Suppliers: Your Timeline and Checklist
Once a business decides to switch energy suppliers, comprehending the switching timeline becomes essential to avoiding service interruptions and unexpected costs.
The switching process operates under strict regulatory timelines. Micro businesses experience expedited switches completed within five business days maximum, whilst standard switches may take up to 30 days if out of contract. A 14-day cooling-off period applies after contract signup, allowing reconsideration before final commitment.
Supplier selection requires preparing essential documentation:
- Business name, address, and current supplier contract details
- Average energy consumption records and banking information for direct debit setup
- Metre installation charges or security deposits that may apply
The new supplier manages contact with the previous provider and confirms the switchover date, which can require up to three weeks.
If switching exceeds six weeks, customers should request progress updates from their supplier within the 14-day response requirement.