Uncover hidden savings on restaurant energy bills—comparison tools reveal tariffs competitors won't tell you about.
Restaurant owners haemorrhage thousands on energy bills yearly—mostly without realising how quick the fix is. Comparison tools do the heavy lifting: punch in your postcode and consumption data, get quotes in seconds. Deregulated markets offer fixed-rate contracts from competitive suppliers that actually beat traditional utilities. Average savings? £1,027 to £1,450 easy. Energy audits dig deeper, identifying inefficiencies costing thousands annually. Understanding your consumption patterns first matters though—peak demand times drastically shift which tariff works best. The specifics of maximising these tools? That’s where things get interesting.
Understanding Your Restaurant Energy Bill Components
Restaurant energy bills aren’t simple. They’re sprawling documents crammed with multiple cost allocations that blur together like yesterday’s grease trap.
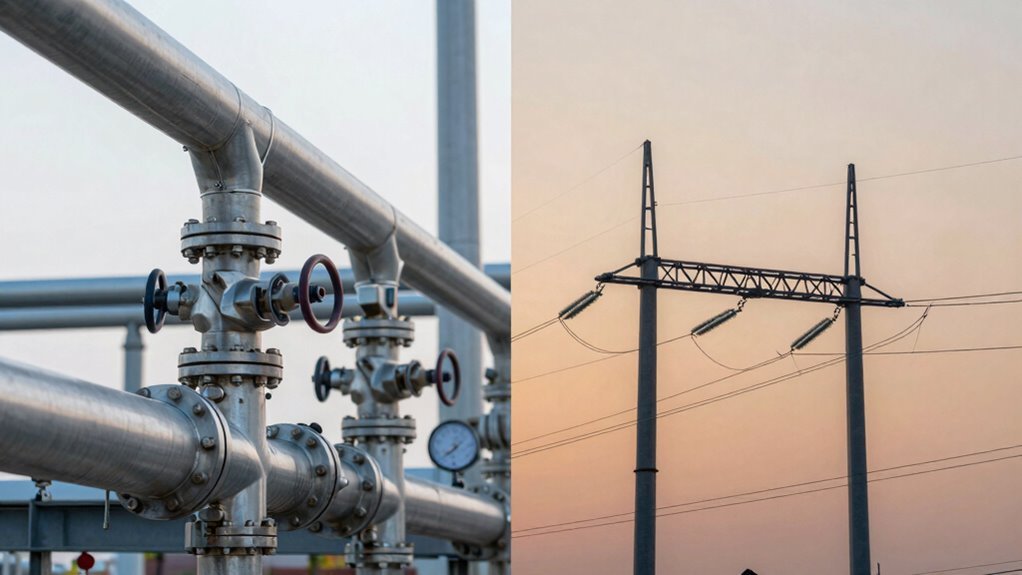
Electricity dominates—typically £1,000 to £3,000 monthly for lighting, refrigeration, cooking equipment, and HVAC. Natural gas follows close behind at £500 to £2,000, fuelling stoves and water heaters.
Then there’s water: £300 to £1,000 monthly for prep work and cleaning. Add waste management (£200-£500) and suddenly grasping bills feels impossible. Utility costs represent about 3% to 5% of your overall operating expenses, making even small tariff reductions meaningful to your bottom line.
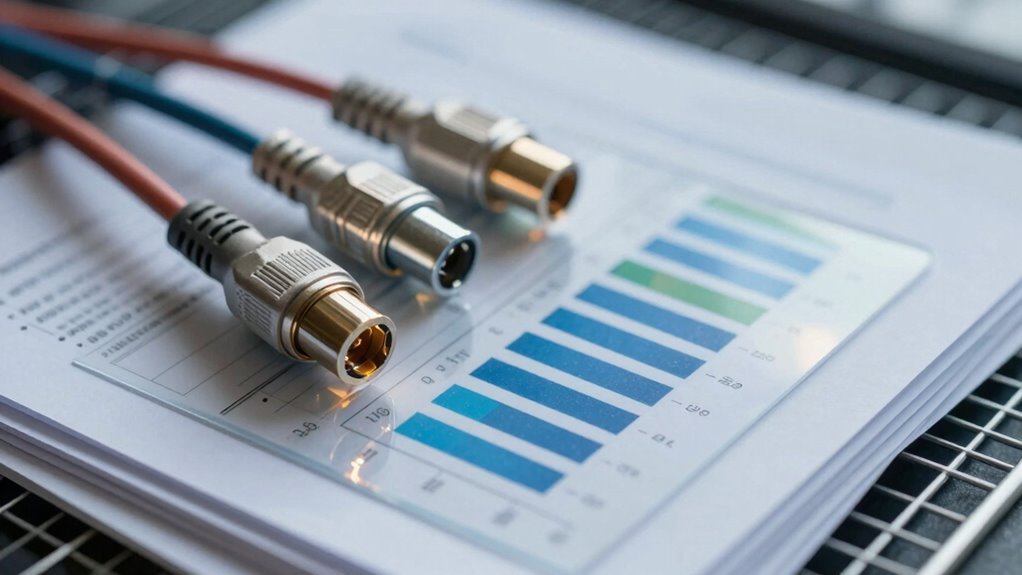
The real issue? Nobody explains what’s actually driving these numbers. When comparing supplier options, working with an adviser can help you understand the transparent explanation of options available and identify which tariffs truly offer value. Many restaurants benefit from uploading recent bills to receive tailored, comparable options from leading suppliers. Structuring your consumption data through energy data analytics reveals which suppliers align best with your actual usage patterns. A standardised data approach ensures accurate metre validation and meaningful tariff comparisons across providers.
Food prep devours 35% of energy consumption. HVAC systems steal another 28-40%. Restaurants consume 5 to 7 times more energy per square foot than other commercial businesses, amplifying the impact of tariff rate differences.
Refrigeration barely registers at 6%, despite occupying precious kitchen real estate. Sanitation and water usage contribute 18%. Lighting rounds things out at 13%.
Buried beneath tariff rates and standing charges sits this messy reality: cost allocations matter deeply when comparing suppliers.
Know what’s actually consuming energy, and suddenly those tariff comparisons make sense.
Identifying If Your Location Qualifies for Deregulated Energy Markets
Once you’ve worked out what’s actually draining money from your energy bill, here’s the hard truth: not every restaurant can shop around.
Energy deregulation isn’t nationwide—it’s a patchwork mess. Only about 18 states and Washington D.C. have deregulated electricity markets. Your market eligibility depends entirely on where you operate.
Some deregulated states only freed up electricity. Others did gas. Some did both. Municipal utilities? Usually stuck in the regulated world regardless. Rural areas? Often left behind too.
Check your options:
- State Public Utility Commission websites show deregulation status by location
- Utility company service maps reveal regulated versus deregulated territories
- Your energy bill displays supplier information and rate codes
- Competitive provider eligibility checkers verify your address via postcode
- Local chambers of commerce provide regional market structure guidance
- Fixed-rate contracts from competing suppliers can often provide lower costs than traditional utility rates. Commercial restaurants should also verify that small C&I rate increases in their region won’t offset potential savings from supplier switching.
- For larger restaurant groups with high energy consumption, bespoke energy tendering can help secure competitive contracts tailored to your specific usage patterns and location.
Know your territory before comparing anything.
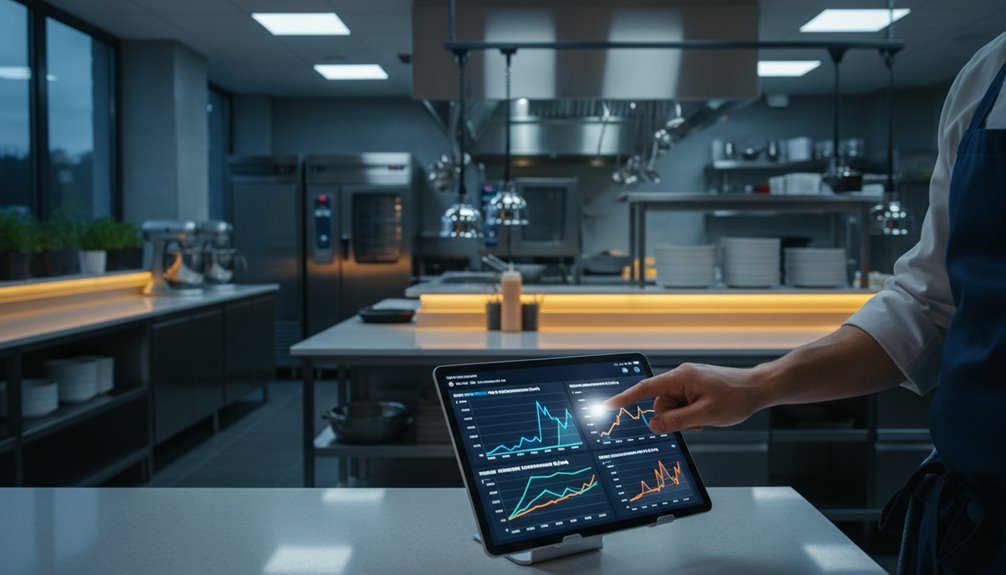
Energy comparison tools exist. They’re basically shortcuts to sift through what suppliers actually charge.
Restaurants enter their postcode, business type, and annual consumption—boom—comparison platforms pull current energy quotes within seconds. Some deliver live tariffs in 30 seconds flat. Others connect directly to smart grid data, slashing manual form-filling by roughly 70%.
Business Energy Quotes finishes comparisons in about three minutes. Fully online. No phone calls required. The platforms automatically grab consumption data when customers submit their address, so restaurants don’t need to dig through old invoices.
Comparison sites filter by business type, standing charges, and unit costs. MoneySuperMarket reports average savings hitting £1,027 when switching. Bionic claims up to £1,450 in potential savings.
The process is genuinely straightforward—if you’ve got your numbers ready.
Leveraging Professional Energy Audit Services
Beyond comparison tools and tariff sheets lies a harder truth: most restaurants have no actual idea where their energy money goes. A professional energy audit cuts through the guesswork.
It’s a systematic review of consumption patterns, equipment efficiency, and operational waste—the kind of stuff that actually matters. Auditors examine everything: refrigeration units running 24/7, cooking appliances bleeding heat, HVAC systems working overtime.
They analyse historical bills. They spot peak consumption periods. They catch the obvious culprits—like staff leaving freezer doors open during service.
The energy audit benefits are concrete:
- Identifies operational inefficiencies costing thousands annually
- Establishes baseline metrics for tracking progress
- Delivers prioritised action plans with ROI calculations
- Benchmarks performance against industry standards
- Provides detailed data for supplier negotiations
Cost savings? Restaurants typically capture 10-30% reductions. Some hit 50% or more.
Optimising Usage Alongside Rate Comparisons
Finding the right tariff matters—but only if the restaurant’s actually using energy efficiently in the first place.
Comparing rates without grasping usage patterns is like shopping for cheaper fuel whilst leaving the engine running 24/7. Restaurants need clarity on when they’re consuming the most electricity. Peak evening demand? Weekend cooking spikes? These details shift tariff selection entirely.
Understanding your restaurant’s peak demand times is essential before selecting any energy tariff.
Real-time demand metering reveals exactly where energy goes. Once a restaurant comprehends its consumption breakdown, matching it to time-of-use structures becomes straightforward.
Strategic equipment scheduling during off-peak hours amplifies savings further. Staggering startup times prevents simultaneous power draws that spike demand charges.
The takeaway: know your usage first, then hunt for tariffs that actually align with how the business operates.
Frequently Asked Questions
How Long Does Switching Energy Suppliers Typically Take for Restaurants?
As the saying goes, “time is money.” Restaurant switching timelines typically range from 17 to 21 days once confirmed with a new supplier. Microbusinesses complete the supplier process within five working days, though establishments without contracts may require up to 30 days.
What Happens to My Current Contract if I Switch Suppliers Early?
Switching early typically triggers early termination fees under existing contract terms. Restaurants must complete switches during the final 49 calendar days before expiration to avoid penalties, unless outstanding debts exceed £500.
Are There Hidden Fees or Exit Penalties When Changing Energy Providers?
Exit fees exist but aren’t inevitable—switching during the notice period eliminates them entirely. Hidden charges and switching costs vary by supplier; transparent disclosure of all terms prevents unexpected penalties when changing providers.
How Do I Know if My Restaurant Is Being Overcharged Currently?
A restaurant can identify overcharging by comparing current consumption against industry benchmarks (£2.90/sq ft electricity), performing utility bill audits to detect anomalies, and utilising energy monitoring tools to track usage patterns and identify inefficiencies.
“Two roads split in a wood.” Restaurants can pursue direct negotiation strategies with suppliers—potentially saving 10–30%—or engage intermediaries for thorough supplier relationship management and expert rate comparison across 15+ providers.